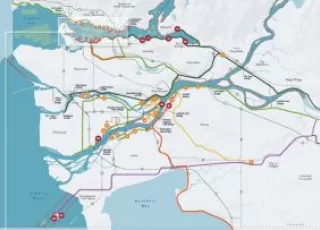
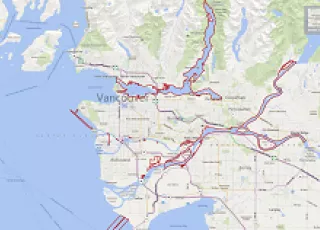
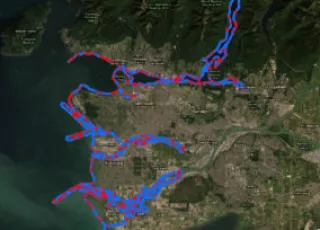
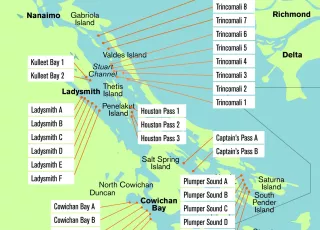
This metrics dashboard features real-time monitoring tools for port users and stakeholders, supply chain performance metrics, and maps.
Real-time monitors
Several real-time monitors are in place throughout the Port of Vancouver to help keep users informed and enable better planning.
eHub app
Our eHub app consolidates real-time supply chain insights from across the Port of Vancouver, including:
- Real-time data collected from drayage truck GPS units, as part of our Truck Licensing System
- Interactive maps for terminals and facilities, major railways, and vessels in port
- Live monitoring from our port operations centre and partner agencies
Supply chain performance metrics
A terminal-level summary of the import rail footage on-dock, the estimated planned car supply, and the actual rail car production on a daily basis. Updated daily.
Aggregated average turn times based on data from TLS licensed trucks. The data reflects both regular and speed gate reservations. Updated Thursdays.
A daily summary of container vessels at berth and at anchor, including berth arrival dates, days at anchor, and estimated time of arrival to berth. Updated weekdays.
As part of our Container Vessel On-Time Incentive Program, we measure vessel on-time arrival within +8 hours of berth window start. Updated monthly.
Anchorage utilization rates at the Port of Vancouver and in the South Coast region, a summary of projected anchorage demand, and ship arrivals at port terminals. Updated daily.
Maps
Resources
For more information about current operational conditions at the port, contact harbour_master@portvancouver.com.


